Use this calculator to compute the z-score of a normal distribution.
Z-score and Probability Converter
Please provide any one value to convert between z-score and probability. This is the equivalent of referencing a z-table.
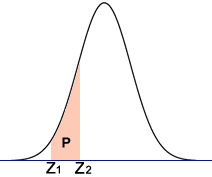
Probability between Two Z-scores
Use this calculator to find the probability (area P in the diagram) between two z-scores.
What
a Z-Score Actually Tells You (And Why Most People Stop Too Early)
A Z-score calculator transforms any raw measurement into
standard-deviation units, giving you an instant answer to one question:
how unusual is this observation? The tool subtracts the mean (μ) from
your value (x), then divides by the standard deviation (σ). That
ratio—(x − μ)/σ—lets you compare heights against weights, stock returns
against bond yields, or patient lab values against population norms. But
here’s the trap most users miss: the Z-score assumes your reference
distribution is stable. In practice, means drift, variances inflate
during crises, and what was “3σ unusual” in 2019 might be routine
volatility today. The calculator gives a standardized position. You must
supply the right distribution to standardize against.
The Mechanics Most Guides
Gloss Over
The formula appears trivial. It isn’t.
$Z = \frac{x - \mu}{\sigma}$
Where: - x = your observed value -
μ = population mean (not sample mean, unless you’re
explicitly working with sample standardization) - σ =
population standard deviation
Three hidden variables corrupt results:
Hidden Variable
What Goes Wrong
Detection
Sample μ used as population μ
Standardization bias; Z-scores cluster artificially near zero
Check if your “population” is itself estimated from < 30
observations
σ computed from recent window only
Temporal instability; Z-scores spike during regime changes
Plot rolling 30-period σ; flag jumps > 40%
x itself is an average of n items
Variance deflation ignored; Z-score understated by √n
Divide final Z by √n if x is a mean
EX — Hypothetical Example:
A quality engineer measures bolt lengths. Population mean μ = 50.0
mm, σ = 0.2 mm. A sampled bolt measures 50.46 mm.
Step 1: Compute deviation. 50.46 − 50.0 = 0.46 mm.
Step 2: Standardize. 0.46 / 0.2 = 2.3.
Step 3: Interpret against standard normal. Z = 2.3 corresponds to
~98.9th percentile—roughly 1 in 100 bolts this long or longer.
But wait. If that “50.46 mm” is actually the average of 4 bolts from
the same batch, the correct Z for the batch mean is 2.3 / √4 = 1.15. The
individual bolt was unusual. The batch average was not. Most online
calculators won’t warn you about this. You must know your data structure
before entering numbers.
When the Normal Assumption
Fractures
Z-scores embed a gamble: that tails behave normally. They often
don’t.
Financial returns famously exhibit kurtosis far exceeding 3. A
Z-score of 4 in a normal distribution suggests a 0.003% event—once per
30,000 observations. In actual S&P 500 daily returns, such events
occur dozens of times per century. The Z-score calculator doesn’t know
this. It outputs the same number regardless of whether your underlying
process generates Gaussian noise or power-law extremes.
Trade-off with numbers:
Approach
Gain
Loss
Raw Z-score with normal p-value
Simplicity; universal comparability
Catastrophic misestimation of tail risk; false confidence
Z-score + robust σ (MAD estimator)
Outlier resistance; 95% breakdown point
Slightly wider intervals; harder to explain to non-technical
audiences
Z-score mapped through empirical CDF
Accurate percentiles for your specific data
Requires large sample; loses cross-dataset comparability
If you choose robust σ (median absolute deviation / 0.6745), you gain
protection against single outliers corrupting your baseline. You lose
the elegant variance-additivity properties that make classical Z-scores
so mathematically tractable. For a dataset with one extreme outlier,
classical σ might inflate by 80%; MAD-based σ stays stable. But if your
data are genuinely normal, MAD efficiency is ~64% of sample σ—your
Z-scores carry ~25% more sampling noise.
Decision shortcut: For n < 100 or suspected
outliers, compute both. If |Z_classical − Z_robust| > 0.5, distrust
the normal p-value entirely. Switch to empirical percentiles or
bootstrap intervals.
The One Thing to Change
Stop treating Z-score output as a verdict. Treat it as a hypothesis
that your reference distribution is correct. The calculator does the
division. You do the judgment. After running your numbers, ask: did the
mean and standard deviation I entered describe the same process that
generated my observation? If there’s any regime shift, sampling
hierarchy, or outlier contamination between them, your Z-score is a
precise answer to the wrong question. Recalculate with robust
estimators, validate against empirical percentiles, or abandon
standardization entirely for rank-based methods when your distribution
shape is unknown.
Informational Disclaimer
This content explains mathematical procedures for educational
purposes. It does not constitute professional statistical, financial,
medical, or engineering advice. For decisions involving health outcomes,
regulatory compliance, or material financial risk, consult a qualified
professional who can evaluate your specific data context and domain
requirements.
Definition and Core Value
A Z-score calculator is a statistical tool that computes the standardized score (z-score) that indicates how many standard deviations a given data point lies above or below the mean of a normally distributed population. Z-scores enable comparison of measurements from different scales and distributions, transforming diverse data into a common scale where direct comparisons become meaningful. This transformation is fundamental to hypothesis testing, quality control, and statistical analysis across virtually every scientific discipline.
The core value of a Z-score calculator lies in its ability to make sense of data that would otherwise be incomparable. A test score of 85 might be outstanding in one class but average in another; a salary of $75,000 might be high in one region but modest in another. By converting values to z-scores, we can immediately understand where any observation stands relative to its population, enabling fair comparisons regardless of the original measurement scale.
How to Use the Z-Score Calculator Accurately
Using a Z-score calculator requires understanding three key values: the raw data point (x), the population mean (μ, mu), and the population standard deviation (σ, sigma). The raw data point is the individual value you're evaluating—whether that's a test score, a measurement, a salary, or any other quantitative observation. The population mean is the average of all values in the dataset you're comparing against, and the population standard deviation measures how spread out those values are.
Enter the raw score (x) in the first field, then enter the population mean (μ). Some calculators ask for these separately, while others combine them by asking for the difference (x - μ). Enter the population standard deviation (σ) in the designated field. The calculator will return the z-score, indicating how many standard deviations the raw score is above (positive z) or below (negative z) the mean.
For sample data rather than complete population data, use the sample mean and sample standard deviation (or standard error) instead. While technically this produces an approximation rather than a true population z-score, the difference is negligible for large samples. When working with small samples, consider using Student's t-distribution instead, which the basic z-score calculator cannot handle.
Real-World Scenarios and Case Studies
Standardized Test Comparison: A college admissions officer compares applicants from different testing backgrounds. One student scored 1400 on the old SAT (mean 1000, SD 200), another scored 32 on the ACT (mean 21, SD 5). Converting to z-scores: SAT z = (1400-1000)/200 = 2.0, ACT z = (32-21)/5 = 2.2. Despite the different scales, the admissions officer immediately sees the ACT scorer performed slightly better relative to their test's distribution.
Manufacturing Quality Control: A widget must be 50mm ± 0.5mm to fit properly. A batch shows measurements with mean 50.1mm and standard deviation 0.2mm. A specific widget measuring 50.4mm has z-score (50.4-50.1)/0.2 = 1.5, meaning it's 1.5 standard deviations above the batch mean. Quality engineers use z-scores to determine whether variation is acceptable or indicates a process problem requiring intervention.
Medical Diagnostic Testing: A patient's bone density measurement is 0.95 g/cm². Population data shows healthy young adults average 1.0 g/cm² with standard deviation 0.15 g/cm². The z-score of -0.33 indicates the patient's score is about one-third of a standard deviation below the young adult mean, providing objective context for diagnosis rather than relying on subjective interpretation of the raw number.
Target Audience and Key Benefits
Students and Educators: Statistics students use z-score calculations to understand distributions, probability, and hypothesis testing. Educators benefit from z-scores when grading on curves, comparing student performance across different exams, or identifying students who may need additional support based on their standardized position within a class.
Researchers and Data Scientists: Statistical analysis in psychology, sociology, economics, biology, and other fields relies heavily on z-scores for data standardization, outlier detection, and hypothesis testing. The ability to quickly calculate z-scores enables researchers to focus on interpretation rather than manual computation, accelerating the analytical process.
Business Analysts and Financial Professionals: Z-scores are used in quality control, financial metrics, market analysis, and risk assessment. Altman Z-scores predict corporate bankruptcy probability; process capability indices use z-scores to quantify manufacturing performance; and investment analysts use standard scores to compare performance across different asset classes.
Key Benefits: Enables comparison across different measurement scales; identifies outliers and extreme values; supports hypothesis testing and confidence intervals; aids in grade normalization and educational assessment; facilitates quality control in manufacturing; and provides standardized framework for interpreting any normally distributed data.
Technical Principles and Mathematical Formulas
The z-score formula is: z = (x - μ) / σ, where x is the raw score, μ is the population mean, and σ is the population standard deviation. This formula tells us exactly how many standard deviations the raw score lies from the mean—dividing the distance from the mean by the standard deviation normalizes the measurement.
The resulting z-score indicates the position on a standard normal distribution, where the mean is 0 and standard deviation is 1. A z-score of 2.0 means the value is 2 standard deviations above the mean; a z-score of -1.5 means it's 1.5 standard deviations below the mean. This standardization allows us to use Z-tables to find probabilities associated with any value once we know its z-score.
Z-scores are most meaningful for data that follows a normal distribution (bell curve). While the formula can be calculated for any data, the interpretation using z-tables and standard probability calculations only applies to normally distributed data. For non-normal distributions, percentiles or other non-parametric methods provide more appropriate comparisons.
Frequently Asked Questions
Q: What does a negative z-score mean?
A: A negative z-score indicates the raw score is below the population mean. For example, z = -2.0 means the value is 2 standard deviations lower than average. This doesn't necessarily indicate a problem—it depends entirely on context. In some applications (like test scores), negative z-scores may be concerning; in others (like cholesterol levels), a negative z-score might indicate a desirable result.
Q: Can z-scores be greater than 3 or less than -3?
A: Yes, theoretically z-scores have no bounds. In a standard normal distribution, approximately 99.7% of values fall within ±3 standard deviations, meaning only about 0.3% of observations would be expected to have |z| > 3. Observed values beyond these bounds are extremely rare and often indicate either measurement error or a distribution that isn't actually normal.
Q: What's the difference between z-scores and standard scores?
A: In statistical terminology, "standard score" is the broader concept, and z-score is a specific type of standard score that uses the standard normal distribution (mean 0, standard deviation 1). Other standard scores like T-scores (mean 50, SD 10) or IQ scores (mean 100, SD 15) use different reference distributions but serve the same fundamental purpose of enabling comparison across different scales.
Q: When should I use z-scores versus percentile ranks?
A: Use z-scores when you need to compare across different distributions, calculate probabilities using the normal distribution, or perform statistical tests. Use percentile ranks when you want to communicate a value's position in simple, intuitive terms (e.g., "you scored in the 85th percentile" is more understandable than "your z-score was 1.44").
Q: Why is z = 0 considered the mean?
A: When a raw score exactly equals the population mean (x = μ), the numerator of the z-score formula becomes zero, resulting in z = 0. This makes intuitive sense: if you're exactly at the average, your standardized score should be zero—the baseline position. The standard normal distribution is centered at z = 0 precisely because it represents the mean of standardized values.